Using Six Sigma Tools for Project Risk Management
Show your work. It’s not just for math teachers. I’m a big fan of using and creating tools that allow me to explain and someone to follow my thought process. While great as a communication tool it also allows me to share my ideas with others and how I came to my conclusions. I currently work with inventors and students in the nascent stages of commercialization. Mainly engineering or PhD types working on a product idea, the simple question “Who’s this for…?” causes puzzlement and consternation. “Do you have written requirements…?” A Requirements Document is a simple example of showing your work. Others can look over the requirements and contribute by seeing what is written down. It allows you to constantly input, review, and modify any requirements as new learnings and discoveries are made.
I use this example to help explain using a Cause & Effect Diagram, aka Ishikawa Diagram or Fishbone Diagram, for project risk management. This is a simple Six Sigma Tool to assist in understanding where areas of risk may develop. In Figure 1 below you can see the sections of the diagram. The Effect is listed in the box on the far right. You list ONE item of failure (or you could list a success), Scope, Schedule, or Cost. Then under the six main groupings of Measurement, Materials, Personnel, Environment, Methods, and Machines you list input factors that may have an effect on the output of Scope, Schedule, or Cost.
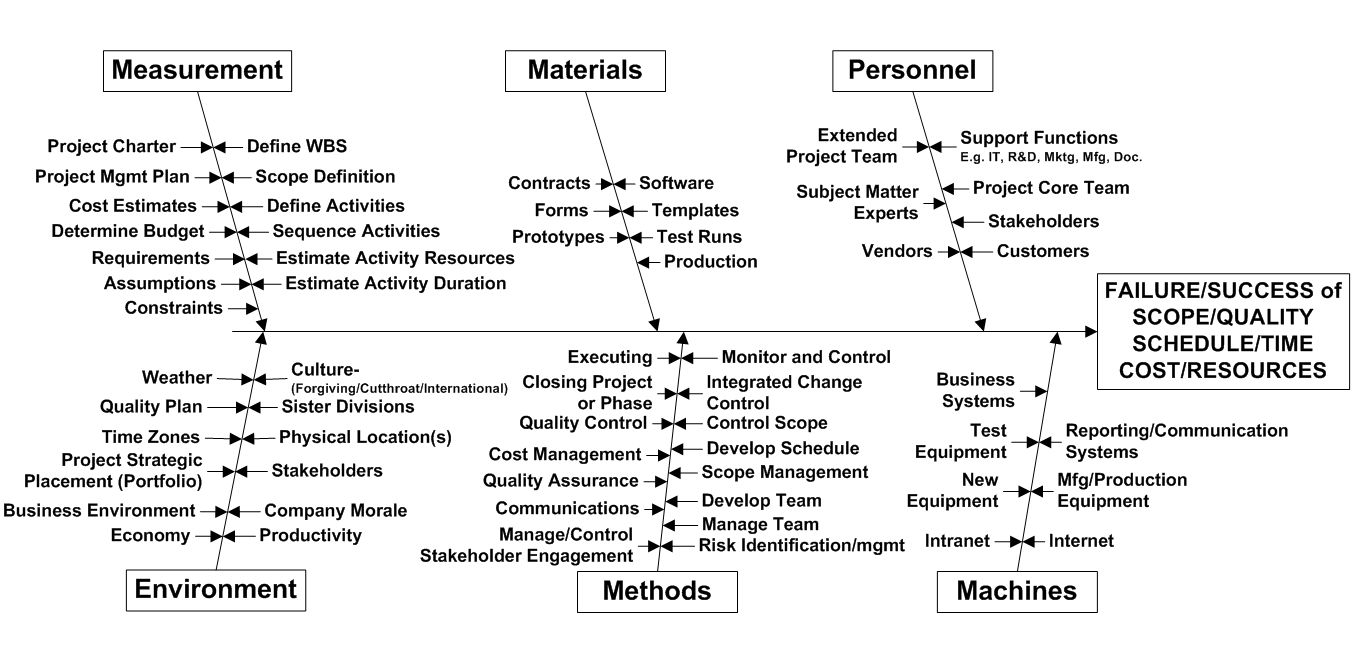
Figure 1 Project Management Cause & Effect Diagram
In Figure 1 I’ve listed many items as found in the Project Management Body Of Knowledge (PMBOK) 5th Ed. plus a few others. This is to help with the thought process. For each of the secondary inputs you should be able to add additional detail. For example, under Environment>Physical Location you could add additional legs for each of the various plants/division locations that interface with your project. Many global companies develop in one location, pilot in another, and scale up in a third location. Each of these should be listed. Each one has its own risks associated with it. THAT’S THE POINT. You’ve now identified a potential risk to add to your risk register to grade and review and determine its level of risk. Any risk item must fit on the cause and effect diagram because it is an input that has an effect on the output, e.g. schedule. YOU’VE JUST SHOWN YOUR WORK. In the risk reviews I’ve participated in everyone starts listing detailed risks. There is no systematic method to ensure you’ve at least looked over the landscape. Another way of putting this is looking from the 10,000 foot lever meaning a broad overview. Now someone else can come along and review your Risk related Cause & Effect Diagram at both a high level and detail level.
This tool is a way to systematically review and capture a wider and deeper look at potential risks. Let’s not forget that it may also be used to capture success’ and understand what inputs were driving successful projects. This is a simple tool to assist in better outcomes and at the same time allowing others to follow your thought process. Show your work!
